
Anchoring Bias
An earlier number can pull a later estimate towards it, especially when the answer is uncertain.
In one sentence
Anchoring is a shift in a numerical estimate towards a value considered beforehand. The anchor may be relevant or arbitrary, and people can remain too close to it when forming their answer. Anchoring is not simply paying attention to the first or most prominent interface element; those effects are better described as order, salience or a default.
Try this in practice
Make the idea useful.
Use these as hypotheses to test in your own product and context—not as predictions about what people will do.
- Identify every number that could become a reference point: previous prices, suggested amounts, time estimates, ratings, targets and ranges. Show why the number is relevant, use comparable terms and never invent a recommended retail price or saving.
- Help people form an independent view. Show the current absolute value, total cost and a neutral range; let them enter their needs before highlighting a recommendation; and make reasons why the comparison may not fit easy to inspect.
- Test high, low and no-anchor versions with the intended audience. Measure understanding, estimate accuracy, decision quality, regret, complaints and effects on lower-knowledge groups—not conversion alone. Stop if an anchor changes choice without improving comprehension or fit.
- Use it when
- Helps teams spot when prices, estimates, targets or ranges may become unintended reference points—and replace them with relevant, explainable comparisons.
- Watch for
- Irrelevant or inflated numbers can distort perceived price, effort, risk or value, especially when people have limited knowledge. Using them to make an option look better can be manipulative.
Seen in real products
How teams put it to work.
Examples identified in our interface teardowns, linked back to the full product journey.

Five minutes is the first numerical reference in an ordered set up to twenty minutes. It is a possible anchor; only comparative data can show whether it changes target selection.
View Duolingo onboarding: course setup, first lesson, streaks, profile and Super offer →
“2 minute lesson” provides a numerical reference for expected duration before the lesson. This is a possible effort anchor, not evidence that the person finds the lesson easy or continues.
View Duolingo onboarding: course setup, first lesson, streaks, profile and Super offer →
Book cards show a current price beside a struck-through RRP. The RRP is a numerical reference for judging the current price; its usefulness depends on the reference being genuine, current and directly comparable.
View Amazon product discovery: personalisation, deals, lists and recommendations →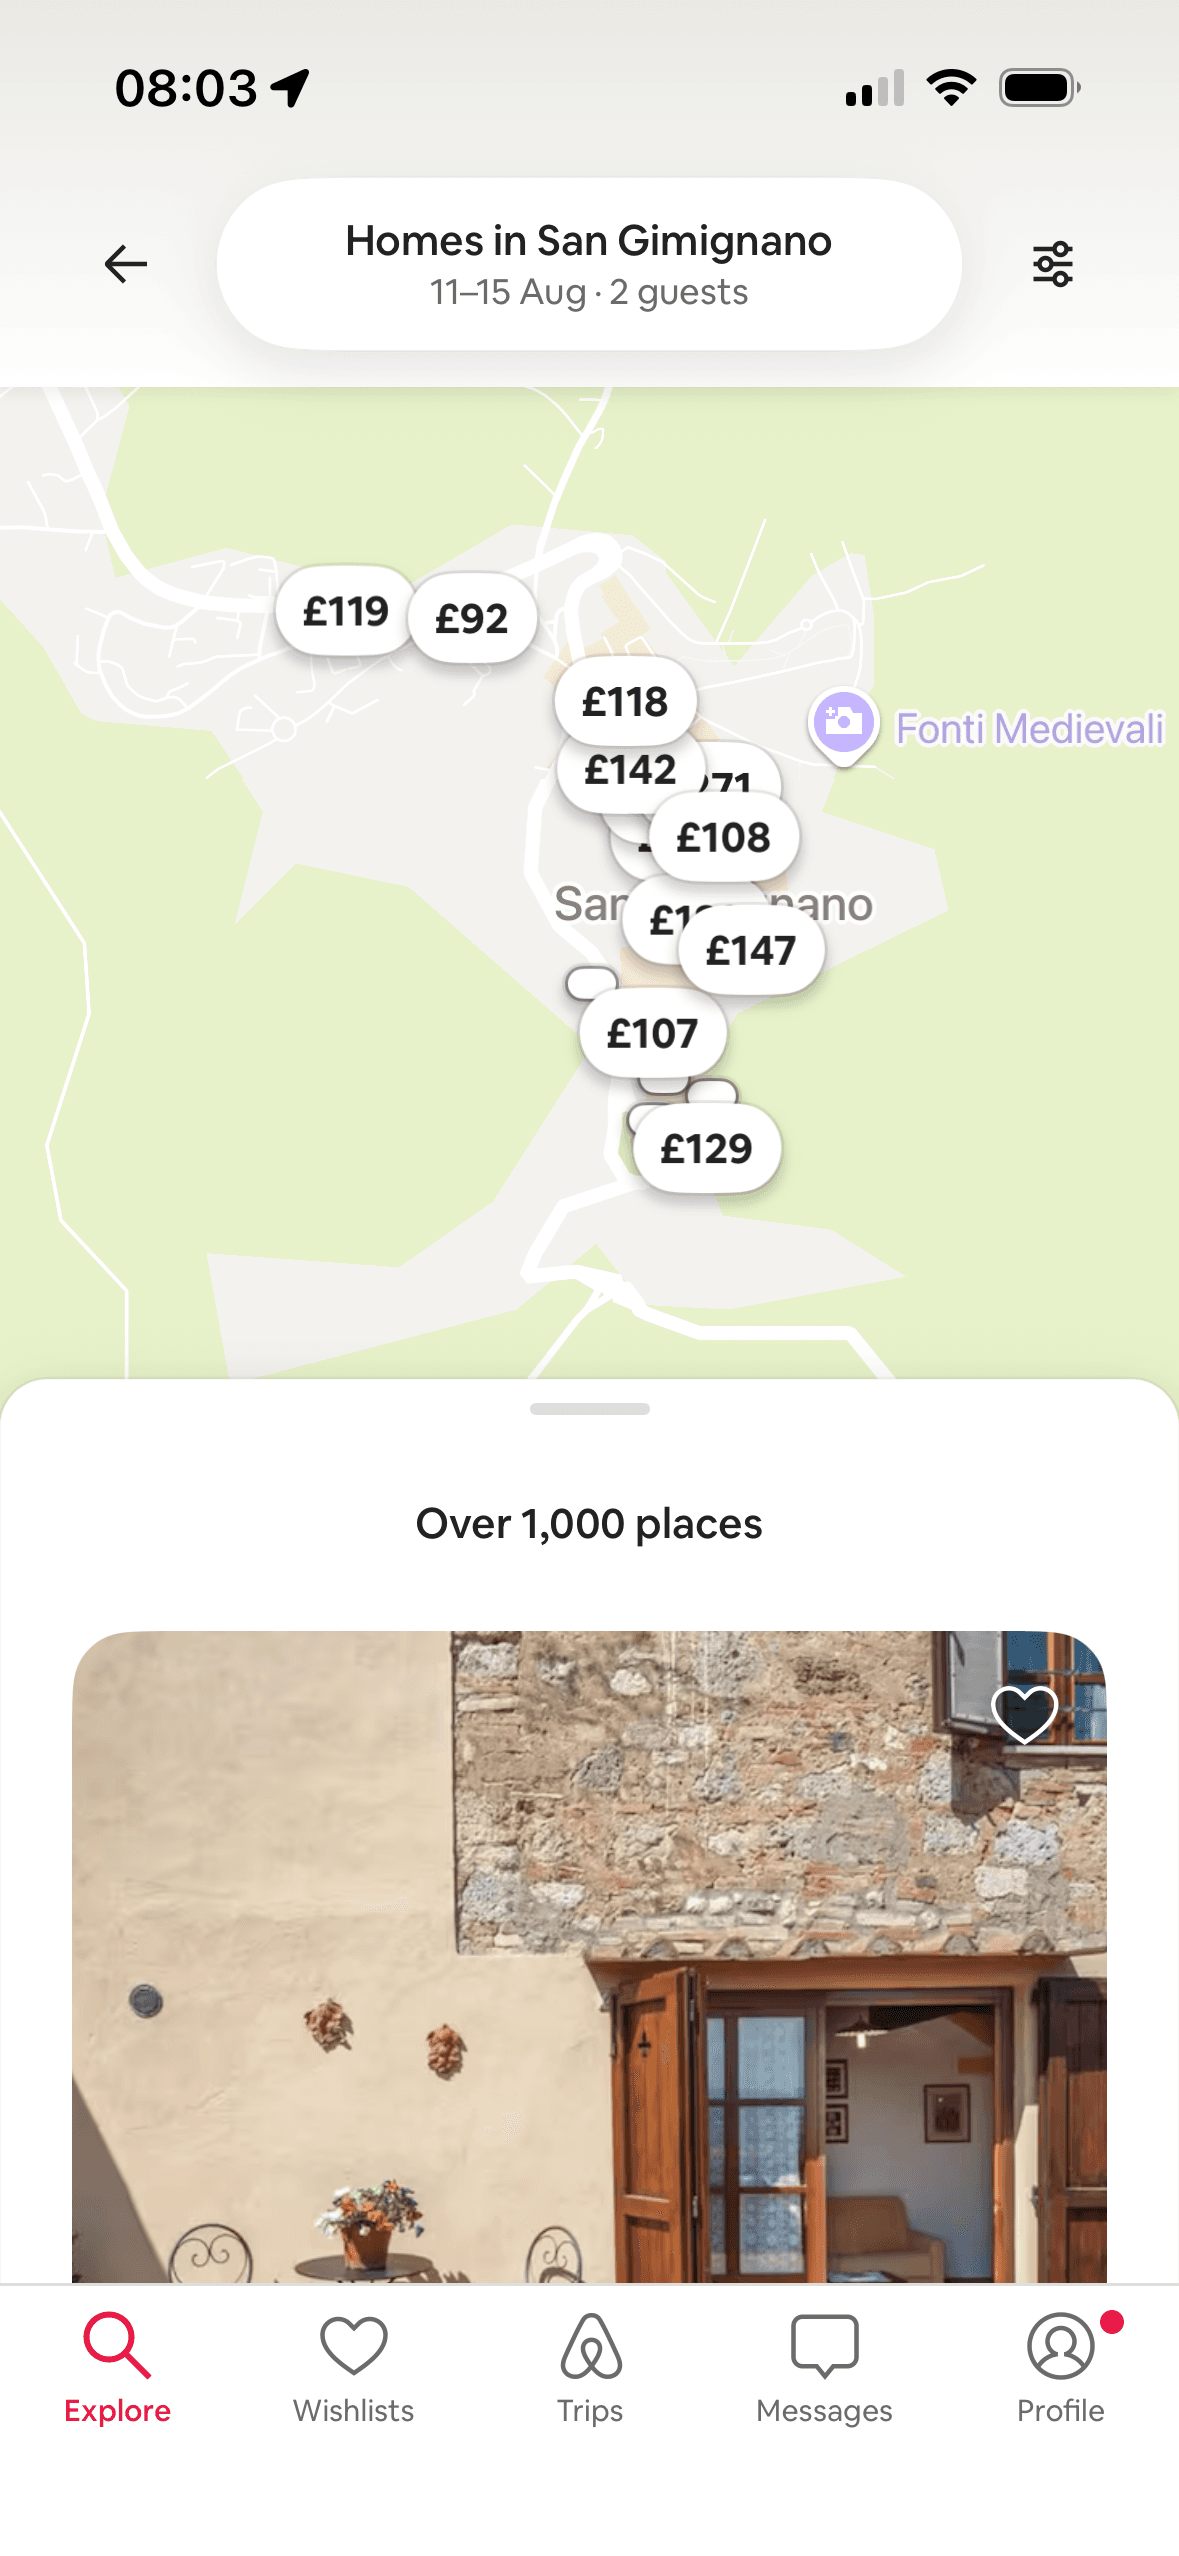
The map shows multiple visible price markers before a listing card is opened. These prices can provide a comparison range; which markers people see first and whether they change later judgement require behavioural evidence.
View Airbnb discovery: homes, experiences, services and filters →Current interpretation
What this may help explain.
In a demonstration reported by Tversky and Kahneman in 1974, participants watched a wheel produce either 10 or 65. They first judged whether the percentage of African countries in the United Nations was higher or lower than that number, then estimated the percentage. The wheel value was arbitrary, but it provided a numerical starting point for the estimate.
The median estimate was 25% after the anchor of 10 and 45% after the anchor of 65; paying for accuracy did not remove the effect. The article did not report the sample size for this brief demonstration, and it tested a numerical knowledge estimate—not an interface or a purchase. Broader evidence supports the effect but also its limits. A 2026 meta-analysis found a large average high-versus-low anchor effect across 1,280 effect sizes, alongside very high variation between studies. A 2021 meta-analysis of 53 willingness-to-pay and willingness-to-accept studies found a more moderate average relationship and substantial variation by context, with smaller effects in newer studies.
Use this as a starting point for a hypothesis, then check it with your own users and context.
Source check
What this guidance is based on.
3 sources have been checked by The UXologist. Findings and limitations are shown together so you can judge how well they fit your situation.
Fifty Years of Anchoring Effects: A Theoretical Reintegration and Meta-Analysis
Research-assisted source review
- What it supports
- The high-versus-low anchor comparison produced a large average effect (Hedges’ g 0.825, 95% CI 0.765–0.884), but heterogeneity was very high (I² 93.73%). Effects were reduced or null for incidental numeric priming, different-dimension or random anchors, and under several incentive or debiasing conditions.
- Who or what was studied
- A meta-analysis spanning 2,601 effect sizes from the numerical-anchoring literature, including 1,280 effect sizes that compared high-anchor and low-anchor groups.
- Study setting
- Synthesised numerical judgments across experimental paradigms and domains, and examined design features such as anchor source, diagnosticity, dimensional compatibility, incentives and debiasing.
- Where it may not transfer
- A large pooled effect does not predict the result for a particular interface: study effects varied greatly, paradigms and outcome measures differ, and high-versus-low comparisons do not show improvement in user understanding, welfare or real purchase quality.
Anchoring in Economics: A Meta-Analysis of Studies on Willingness-To-Pay and Willingness-To-Accept
Research-assisted source review
- What it supports
- The random-effects average correlation between anchor and valuation was 0.267 (95% CI 0.194–0.338), with substantial heterogeneity (I² 88.2%). Effects were larger for relevant, compatible anchors and buying tasks, while newer studies tended to report smaller effects.
- Who or what was studied
- A meta-analysis of 53 studies from 24 articles that elicited willingness to pay or willingness to accept and reported a relationship between an anchor and a monetary valuation.
- Study setting
- Combined laboratory, classroom and field studies using random, fixed or related numerical anchors in buying and selling valuation tasks.
- Where it may not transfer
- The synthesis concerns stated economic valuations rather than completed product choices. Included studies and effect-size conversions varied, some article-level study effects were treated as independent, and the authors advise treating the pooled estimate cautiously and potentially as an upper bound.
Judgment under Uncertainty: Heuristics and Biases
Research-assisted source review
- What it supports
- Median estimates were 25% after the anchor of 10 and 45% after the anchor of 65; accuracy payments did not remove the effect. In the multiplication task, ascending and descending sequences produced median estimates of 512 and 2,250 even though the correct product was 40,320.
- Who or what was studied
- The article reports several demonstrations of judgment under uncertainty. It does not state the participant count or demographics for the wheel-of-fortune anchoring demonstration in the published summary.
- Study setting
- Participants compared an unknown percentage with an arbitrary wheel value of 10 or 65, then estimated the percentage of African countries in the United Nations. A second demonstration asked high-school students to estimate a multiplication product within five seconds.
- Where it may not transfer
- The paper provides brief reports rather than full modern method and sample details. These are constrained numerical-estimation tasks, not product-interface or purchasing tests, so they do not support treating every first or prominent element as an anchor.